Data was checked for normality through histogram. Data was not normally distributed. Shapiro-wilk's Test was done on each response and predictor variable, it was observed that P-value <0.05, it indicates significant of data. Bartlett test were also conducted and it was found that P-value is <0.05, which was not significant.
Residuals plots are drawn to show the residuals.
Residuals plots are drawn to show the residuals.
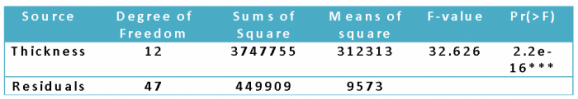
Table No.4.1 Results of one way ANOVA for Fabric Thickness
It can be seen in the results of one way ANOVA Test results the p-value is highly significant for different thicknesses of the fabric.

It can be seen in the results of one way ANOVA Test results the p-value is highly significant, for different masses of the fabric.
Table No.4.2 esults of one way ANOVA for Fabric Mass
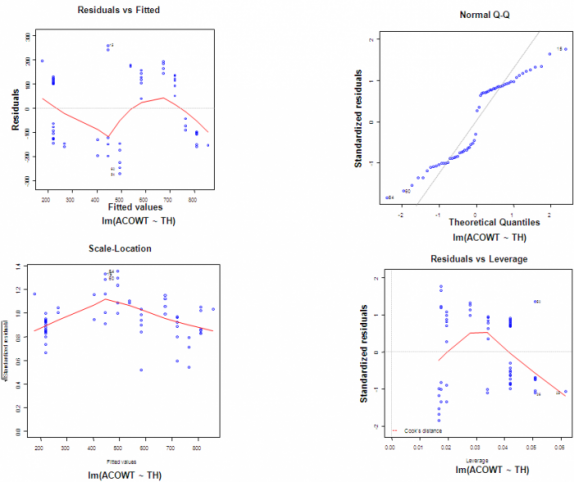
Figure Number 4.1 Residual plots showing relationship between water content percentage and fabric thickness.
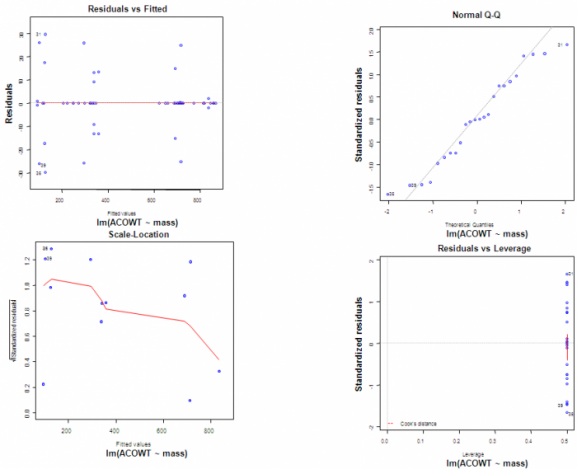
Figure Number 4.2 Residual plots showing relationship between water content percentage and fabric mass.
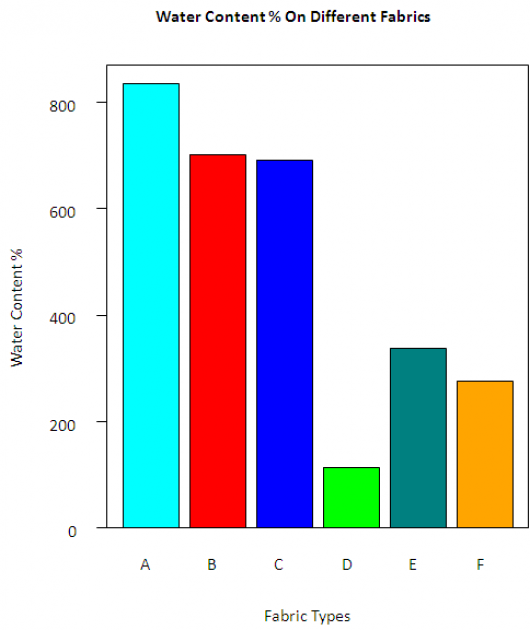
Figure Number 4.3 Water Content % on different fabric.
As shown in figure 4.3, Fabric A has more tendency to absorb the water. While fabrics B & C is almost same . Fabric D has very less water absorbent property.
Therefore,it can be conculded from the above barplot, that fabric A is more suitable for the Moisture Management Fabrics.
Therefore,it can be conculded from the above barplot, that fabric A is more suitable for the Moisture Management Fabrics.
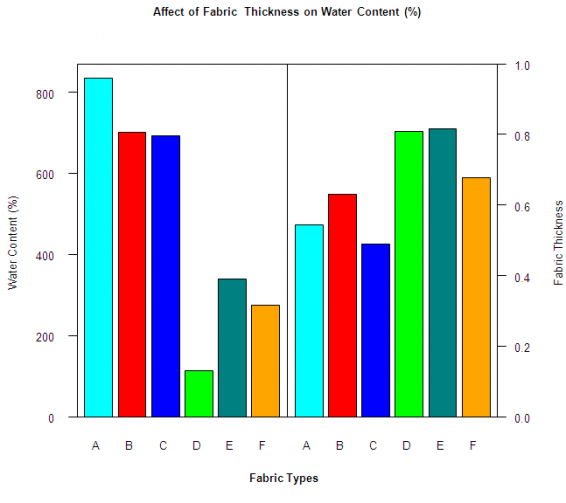
Figure Number 4.4 Affect of Fabric Thickness on Water Content % .
Figure 4.4 shows the relationship between fabric thickness and its impact on water content % of the different fabrics.It can be seen that fabric C has less thickness, but its water absorption rate is low. On other had fabric A is on second number in thickness but it has very high water absorption capability.
Therefore, once again it can be conculded that, Fabric is most suitable fabric among all specimens.
Therefore, once again it can be conculded that, Fabric is most suitable fabric among all specimens.
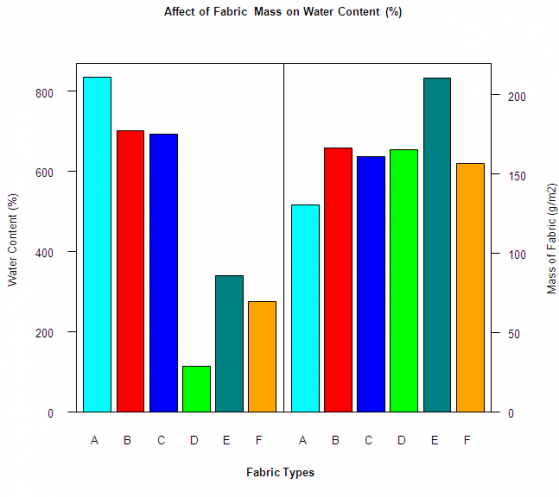
Figure Number 4.5 Affect of Fabric Mass on Water Content % .
Figure 4.5hows the relationship between fabric mass its impact on water content % of the different fabrics.It can be seen that fabric A has less mass and it has also high water absorbency capability.
Therefore, once again it can be conculded that, Fabric is most suitable fabric among all specimens.
Therefore, once again it can be conculded that, Fabric is most suitable fabric among all specimens.
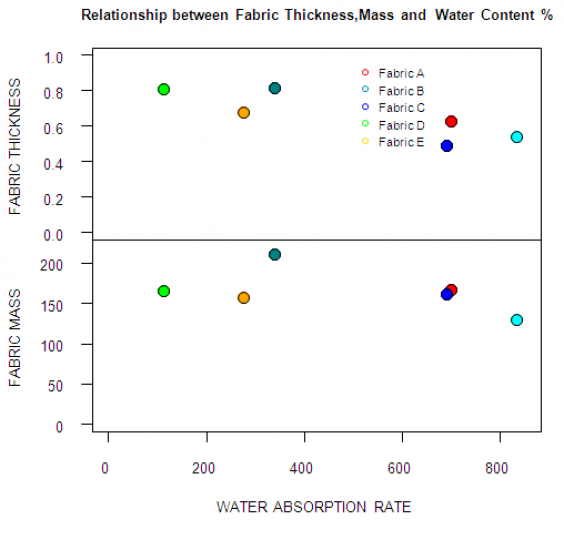
Figure Number 4.6 Relationship between different Thicknesses and Masses of the fabric with Water Content % .
In figure 4.6 scatter plot is drawn to show the water absorption comparsion among different fabric sample, with respect to fabric thickness and fabric mass.
It can be clearly seen from the above scatter plot that, fabric is more suitable for water absorption rate, in contrast with thickness and mass.
It can be clearly seen from the above scatter plot that, fabric is more suitable for water absorption rate, in contrast with thickness and mass.
Disclaimer: This is a class exercise based on modified or randomly generated datasets!
